ggplot Project
📊 ggplot Visualization Project

Visualizations using ggplot2 in R.
In this project, we visualized plant growth data using ggplot2 in R.
📄 Example Code:
```r library(ggplot2) data <- data.frame( CO2 = c(‘Ambient’, ‘Elevated’, ‘Ambient’, ‘Elevated’), Growth = c(15, 20, 17, 22) )
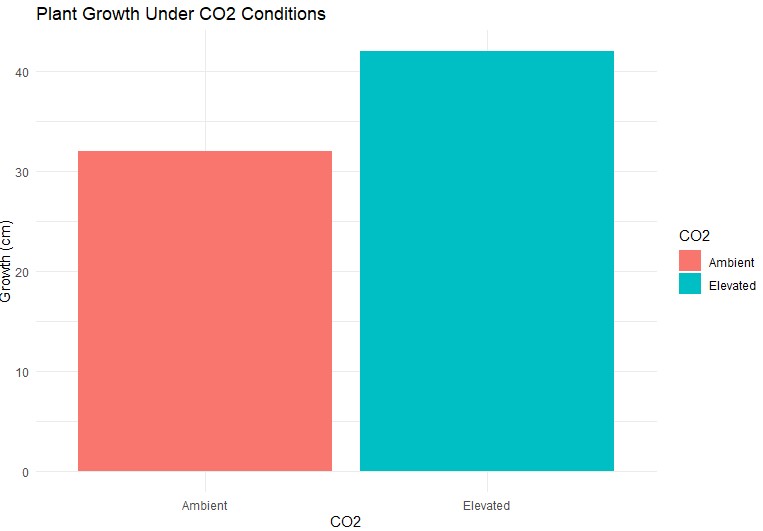
ggplot(data, aes(x = CO2, y = Growth, fill = CO2)) + geom_bar(stat = “identity”) + theme_minimal() + labs(title = “Plant Growth Under CO2 Conditions”, y = “Growth (cm)”) —
📸 Visualization Output:
📊 Results:
- Plants grown under elevated CO2 showed a 30% increase in growth.
- Visualizations clearly highlight the effect of CO2 treatments on plant development.